
Part 2: A Quality Control API
This is the second in a two part series on automated quality control of environmental data. The first part gives an overview of quality control with some specific methods for environmental data. In this post, I describe how I created an API (api.crceanalytics.com) to automatically flag uploaded data using some of the techniques described in Part 1.
Motivation
A couple years ago I began work on a Python package: EnviroDataQC (https://github.com/chrisrycx/EnviroDataQC) that I could use to perform automated quality control on meteorological data being uploaded to DyaconLive, a web portal for Dyacon weather stations. The library didn’t need to be overly complex, I just wanted a way to perform range and behavioral checks in a few different contexts without having to re-write quality control code every time. Recently, I thought it might be interesting to build an API that would connect to EnviroDataQC, creating a means for anyone, anywhere to quickly perform data QC. I built a prototype limited to air temperature data at api.crceanalytics.com and gave it a simple, interactive front end. I think the concept could be taken a lot further eventually.
API Walk Thru
The API front end aims to provide a visual example of how the API works. Anyone visiting the site can submit data for quality control following a few simple steps:
- A user inputs data into a text box (Figure 1).
- Data is submitted to the API and the response is displayed beside the input.
- Unless there is an error, the data will come back with flags indicating data quality.
- The data is plotted in a chart below the input and any flags are displayed on top of the original data (Figure 2).
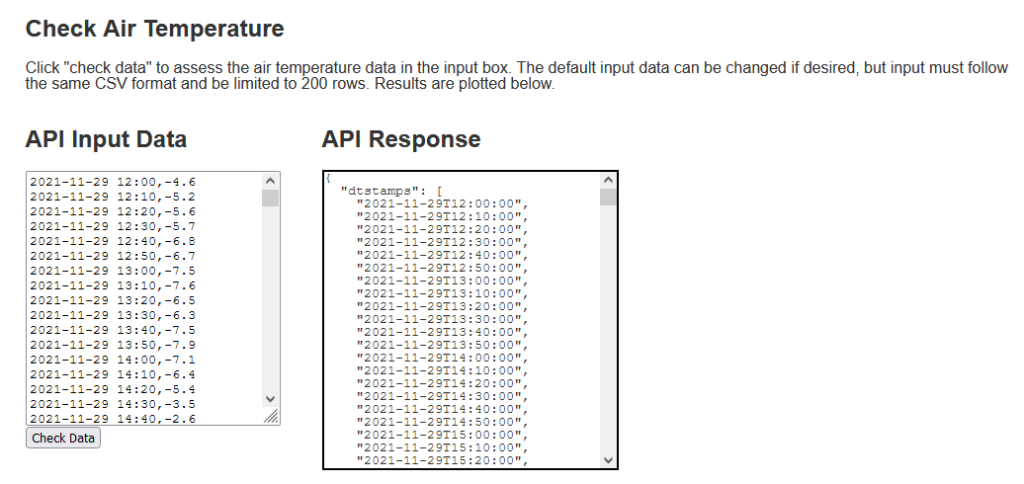
Data entered into the text box should be in comma separated format with the observation time followed by the air temperature value (°C). The input data gets reformatted to JSON as required by the API (See API docs), but I figured it would be easier to copy and paste data from a CSV for general testing and experimentation. The response JSON is displayed beside the input and the input data is returned along with quality flags. The flag values are 0, 1, or 2 representing “good”, “suspicious” and “bad” values. Below the input, the data and flags are plotted to show how data spikes and “flatlining” (data persistance) are identified.
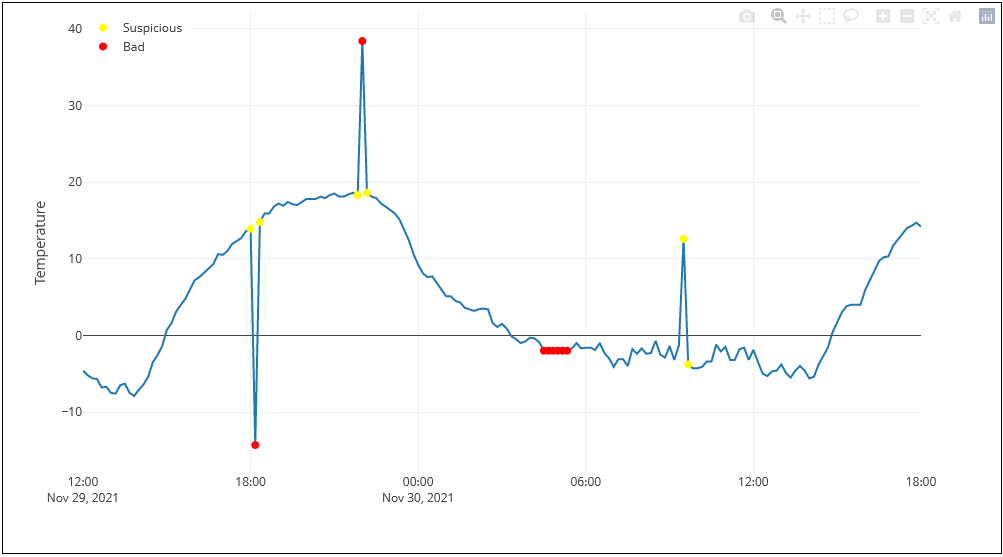
Although the input can be loaded with any data (limited to 200 rows), default data is pre-loaded into the inputs. Figure 2 shows the data plotted along with the flags returned by the API. Large spikes are flagged as ‘bad’ as well as sections of unchanging data that persist for more than 35 minutes. There are also “suspicious” flags adjacent to the larger spikes, as well as identifying a smaller spike. Configuration settings in EnviroDataQC determine what gets flagged.
API Implementation
The API is implemented with Python on the back end and utilizes FastAPI. FastAPI lives up to it’s name and makes API creation really easy. I also found the “Modern APIs with FastAPI” course at TalkPython super helpful. Since, EnviroDataQC was already built, the actual coding of the API fits into one short script. Most of the time spent on this project actually went into the front end and testing some different front end plotting libraries.
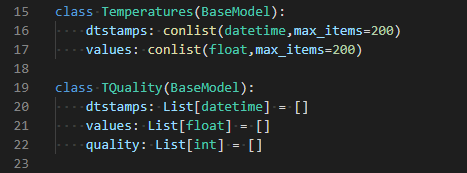
The API code is available on Github (https://github.com/chrisrycx/EnviroData_API) for those interested in creating a similar project. Furthermore, documentation for the API is generated automatically by FastAPI via Swagger (https://swagger.io/) and is accessed via http://api.crceanalytics.com/docs. I found a number of FastAPI features perfect for this project. First, FastAPI uses Pydantic which enforces “type hinting” in Python. For an API that is receiving data, it is important that the incoming data is of a particular type and format so that it can be processed or return an informative error. In the API code, I create a “temperatures” type (figure 3) that contains lists of datetimes and floats corresponding to incoming temperature data that has a value and time stamp. I was even able to limit the number of items, so that a user could not upload too much data.
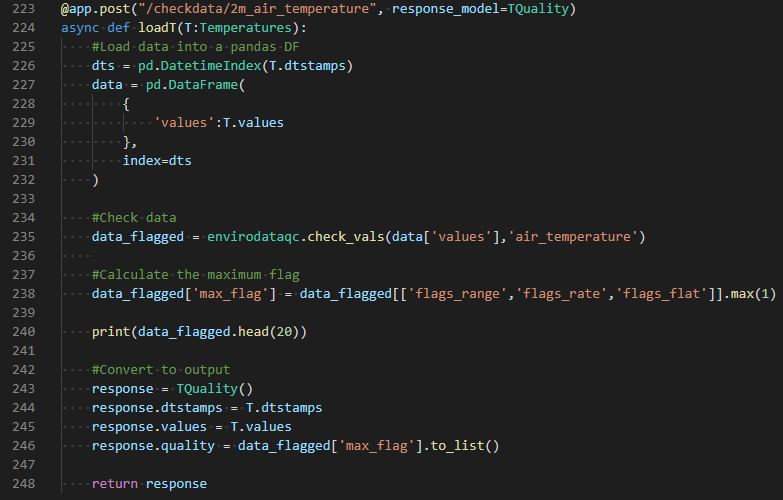
Coding with FastAPI looks similar to using Flask. Application behavior is specified with functions that are connected to a particular route (such as api.crceanalytics.com/check_data/2m_air_temperature) using a decorator (figure 4). Inside the function, the incoming data is parsed and checked using EnviroDataQC functions. Then the response is returned. FastAPI can also render templates, so the back end API code is also used for the front end demonstration page. Total back end code is only around 250 lines.
EnviroDataQC
Data quality is checked using EnviroDataQC, a Python library I developed while working at Dyacon. EnviroDataQC is an initial attempt at implementing the concepts discussed in Part 1 of this series. Data quality is checked with respect to range, rate of change, and persistence (which I tend to call “flatlining”). Additionally, there are some wind consistency checks and a function that attempts to consolidate hourly quality flags into daily values. The package can be PIP installed:
> pip install envirodataqc
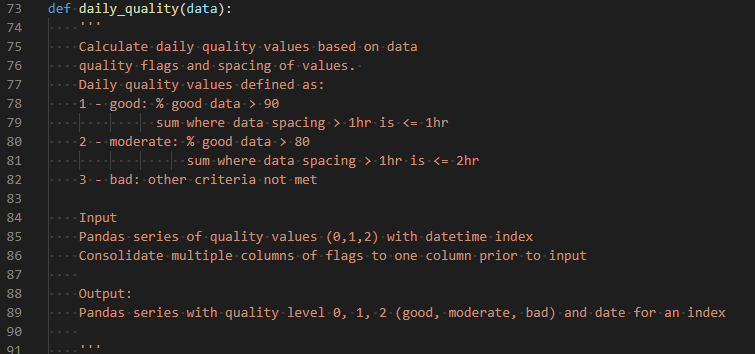
The most basic usage is via the ‘check_vals’ function. This function takes a Pandas series and returns a Dataframe with the original data as well as the flags. The type of variable (air temperature, humidity, ect.) is also specified in the function call and must match a variable type listed in the configuration file (QCconfig.py). A couple interesting features of EnviroDataQC that I haven’t seen elsewhere are flags for suspicious values (as opposed to just flagging data as ‘bad’), as well as an algorithm for consolidating quality flags. Often times data looks strange, but plausible, so flagging it as suspicious enables one to efficiently focus on certain parts of the data for review rather than wasting time reviewing data that is clearly bad. Consolidation of flags is also somewhat unique, and my initial take on the problem is built into the ‘daily_quality’ function. At Dyacon, I was taking 10 minute data with quality flags and reducing it to daily data, such as a daily mean temperature. The daily value needs to have a quality rating that is somehow related to the 10 minute quality flags. I came up with a scheme based on intuition that categorizes the daily values as good, suspicious, and bad based on the number of flags and gaps in the input data (figure 5).
Other software tools
I searched for other open source software tools that perform automated and/or manual quality control of data, but didn’t find that many options. This is surprising given the increased need for data quality control (Campbell et al 2013). It could be that there are general purpose QC libraries that could be applied to environmental data, but haven’t yet become popular in the environmental domain. Another possibility is that QC is not yet standardized enough to drive a need for solutions more sophisticated than spreadsheets and custom scripts (this reason is given by Horsburgh et al. 2015).
Nonetheless, there are some existing open source tools worth testing. My former colleagues at USU developed ODM tools, an interactive GUI for manual data QC. Another similar product I have seen mentioned is the GCE toolbox, however, this library is a Matlab Extension and is therefore not really open source. Another tool developed by Amber Jones and others at USU is PyHydroQC, which is focused on hydrology but appears to have similar functionality to EnviroDataQC, except it does much more by including machine learning methods.
Conclusion
That concludes this two part series on automated QC of environmental data. Let me know in the comments if you have any feedback or have recommendations for open source QC software.
References
Campbell, John L., et al. “Quantity is nothing without quality: Automated QA/QC for streaming environmental sensor data.” BioScience 63.7 (2013): 574-585.
Horsburgh, Jeffery S., et al. “Open source software for visualization and quality control of continuous hydrologic and water quality sensor data.” Environmental Modelling & Software 70 (2015): 32-44.